How to handle SonarQube setup in Java microservice project
java tech tools
4 minutes read
Lately I was faced with a seemingly easy task of setting up SonarQube analysis tool for two microservices within my application. The process appeared quite straightforward but yet it wasn’t so I decided to describe it here thoroughly for further use in the future.
Why use SonarQube anyway?
Measuring code quality is essential for any software project and helps to keep the technical debt low which is a must if you don’t want to end up with messy and unmaintainable code base. SonarQube comes to the rescue calculating code metrics to establish quality of your source code, finding potential bugs and highlighting vulnerabilities. In normal setup all of this is done automatically every time you push your code to external repository which allows you to effectively control the quality and overall condition of your product.
A developer who wants to incorporate SonarQube into his project can choose between two configurations:
- self-hosted instance on one or more servers
- cloud service - SonarCloud
Differences between these two solutions are well described on Devonblog. For my specific setup I will be using self-hosted SonarQube instance.
The recipe for tidy code
The microservices that will incorporate the code analysis tool are based on standard Java & Spring Boot stack with Maven build tool. The first thing to do in that case is to set Sonar plugin in your pom.xml:
<plugin>
    <groupId>org.sonarsource.scanner.maven</groupId>
    <artifactId>sonar-maven-plugin</artifactId>
    <version>3.6.0.1398</version>
</plugin>
Based on SonarQube documentation it is advised to lock down the plugin version.
The next step which brings you closer to a beautiful code free of any technical debt is to set all necessary parameters to correctly configure project analysis. This can be done in several ways depending on the nature of you project but for Maven based application the correct place to do it is in settings.xml file by defining custom build profile. This is actually the most tricky part since a lot of details in configuration may vary depending on the project you want to analyze. For the whole list of parameters possible to use, see this documentation. For my setup the following build profile was implemented:
<profile>
    <id>sonar</id>
    <activation>
        <activeByDefault>true</activeByDefault>
    </activation>
    <properties>
        <sonar.host.url>
            http://sonar.magic.com:9000
        </sonar.host.url>
        <sonar.login>
            4c18560482575c16ce45bc88f7643d57adba3e7r
        </sonar.login>
        <sonar.password></sonar.password>
        <sonar.branch>sonar-showcase-1</sonar.branch>
        <sonar.java.binaries>./target</sonar.java.binaries>
    </properties>
</profile>
When it comes to the profile activation we want it to be available at any time since we perform code analysis during every code push and hence the activeByDefault tag is set to true.
Going further sonar.host.url is as you can guess the URL of our SonarQube instance.
When you want to actually analyze the code you need to somehow authenticate yourself in your analyzer entity during code push. sonar.login and sonar.password will make it possible to authorize yourself in SonarQube. You can pass your plain login and password here but as you can see my solution is different. What you can actually do is to enter your SonarQube site and click on your profile in the upper right corner. Then go to My Account > Security. Here you will be able to generate tokens. If you want to enforce security by not providing credentials of a real SonarQube user to run your code scan or to invoke web services, you can provide a User Token as a replacement of the user login. This will increase the security of your installation by not letting your analysis user’s password going through your network. In my case I chose this solution as it seems more elegant and safe.
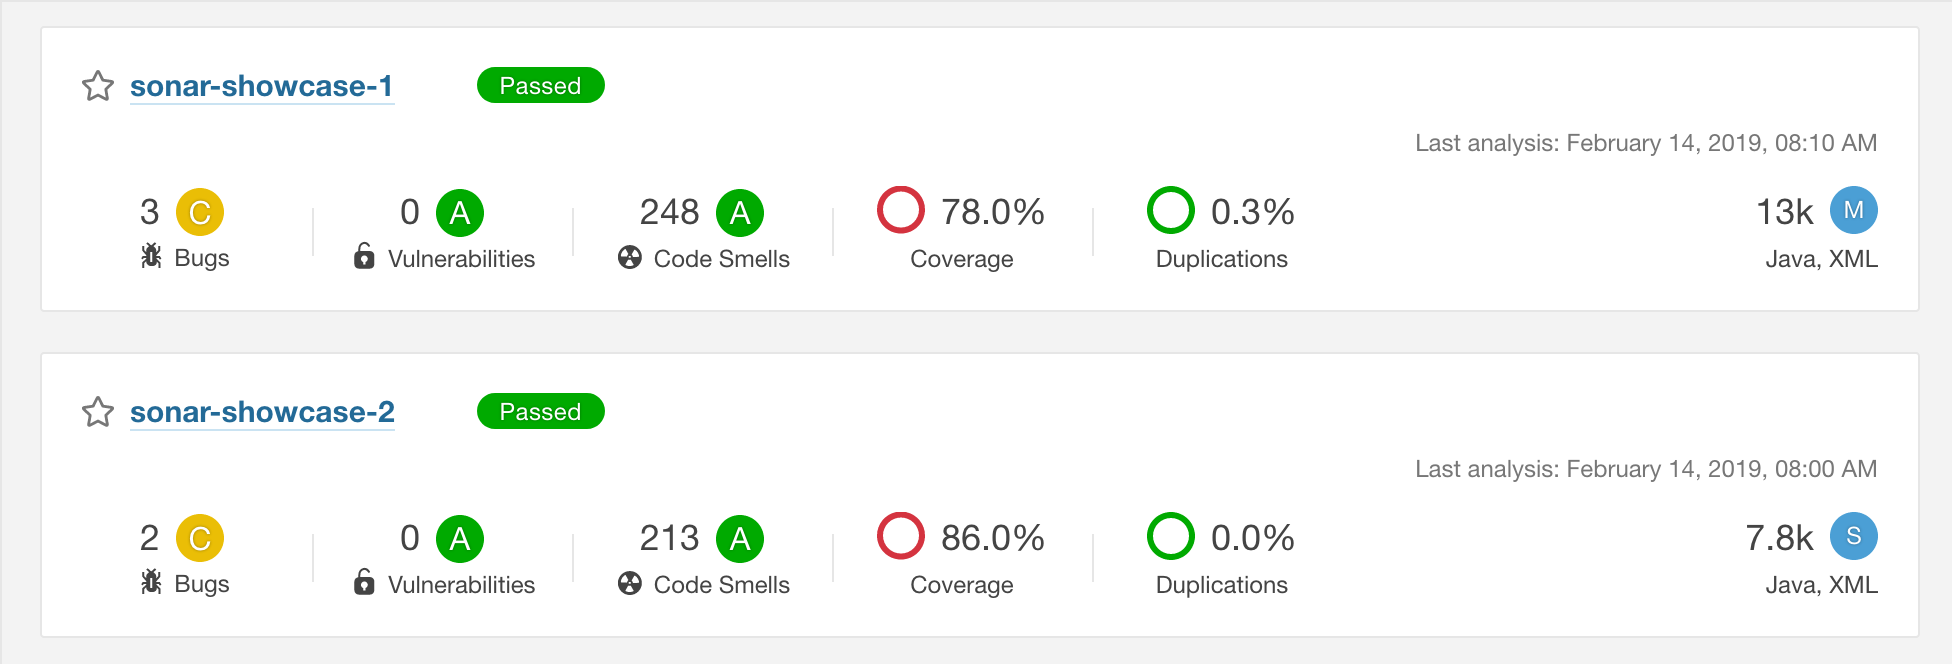
sonar.branch is my own way of dealing with a specific situation which occured in my setup - I was adding SonarQube analysis for two different Java microservices which in fact had the same groupId set in Maven. Now when it comes to analysis of Maven based projects in SonarQube the default way to distinguish between two separate projects is actually the groupId, so in my case every code analysis of one of the microservices overwrote the result since both projects were pointing to the same result report. The solution was to introduce sonar.branch tag in every project and set them to different names. Thanks to this I was able to generate correct results for every project separately.
Last but not least comes the sonar.java.binaries. If you happen to try running you code analysis without this tag you may face the Java bytecode has not been made available to the analyzer. error. To correctly perform analysis you need to point Sonar to the directory where your compiled classes are, in our case (Maven based project) it is /target which contains all compiled classes which will serve as the basis of our analysis.
Having done all that we are ready almost ready to make our shiny code even more shiny.
With this specific configuration we are able to trigger code analysis manually from command line using mvn -s .m2/settings.xml sonar:sonar. But who would like to do it manually? Let’s automate the hell out of it by adding a custom job to our continuous integration service. In my case it was Gitlab so I added this specific job to my .gitlab-ci.yml:
sonar:
  stage: build
  script:
    - mvn -s .m2/settings.xml sonar:sonar
This way every time we trigger the build by pushing any commit the analysis is performed. Voilà!
Shiny happy people developers
And here we are. Our configuration is flawless. Or maybe not, but it is enough to generate these beautiful reports tailored specially for you by our weariless SonarQube every time you trigger a build. What’s left? Hunt those bugs and code smells down and don’t let them spoil your carefully designed project!
